Data & Service Design · 2024 to 2025
Getting everyone back to the same numbers.
Bringing reporting scattered across five tools into one place that brands and internal teams could both trust.
Role
Senior Product Designer
Research
8 stakeholder interviews
Outcome
Up to 8 hours, halved
Audit found
Stock overstated by 80%
Setting the Scene
In 2024, I led the redesign of SoPost’s Reporting Area. The honest version is that the Commercial team didn’t trust the numbers anymore, and I got to be the person who went and found out why.
Before this work, results were scattered across Campaign Manager, spreadsheets, standalone Looker dashboards, Google Docs, and a complex internal tool called Mission Control. Mission Control and Campaign Manager refreshed at different rates, so their totals did not match, and everything built from them became inconsistent and sometimes incorrect. Reports were time-consuming to compile and confidence in the numbers was low.
The goal was to bring all reporting into one reliable suite, so every team from Commercial to Operations, and the brands we worked with, had the same trustworthy view of performance and value.
Scroll to see the rest
Part One
Auditing and Aligning the Foundations
What was wrong
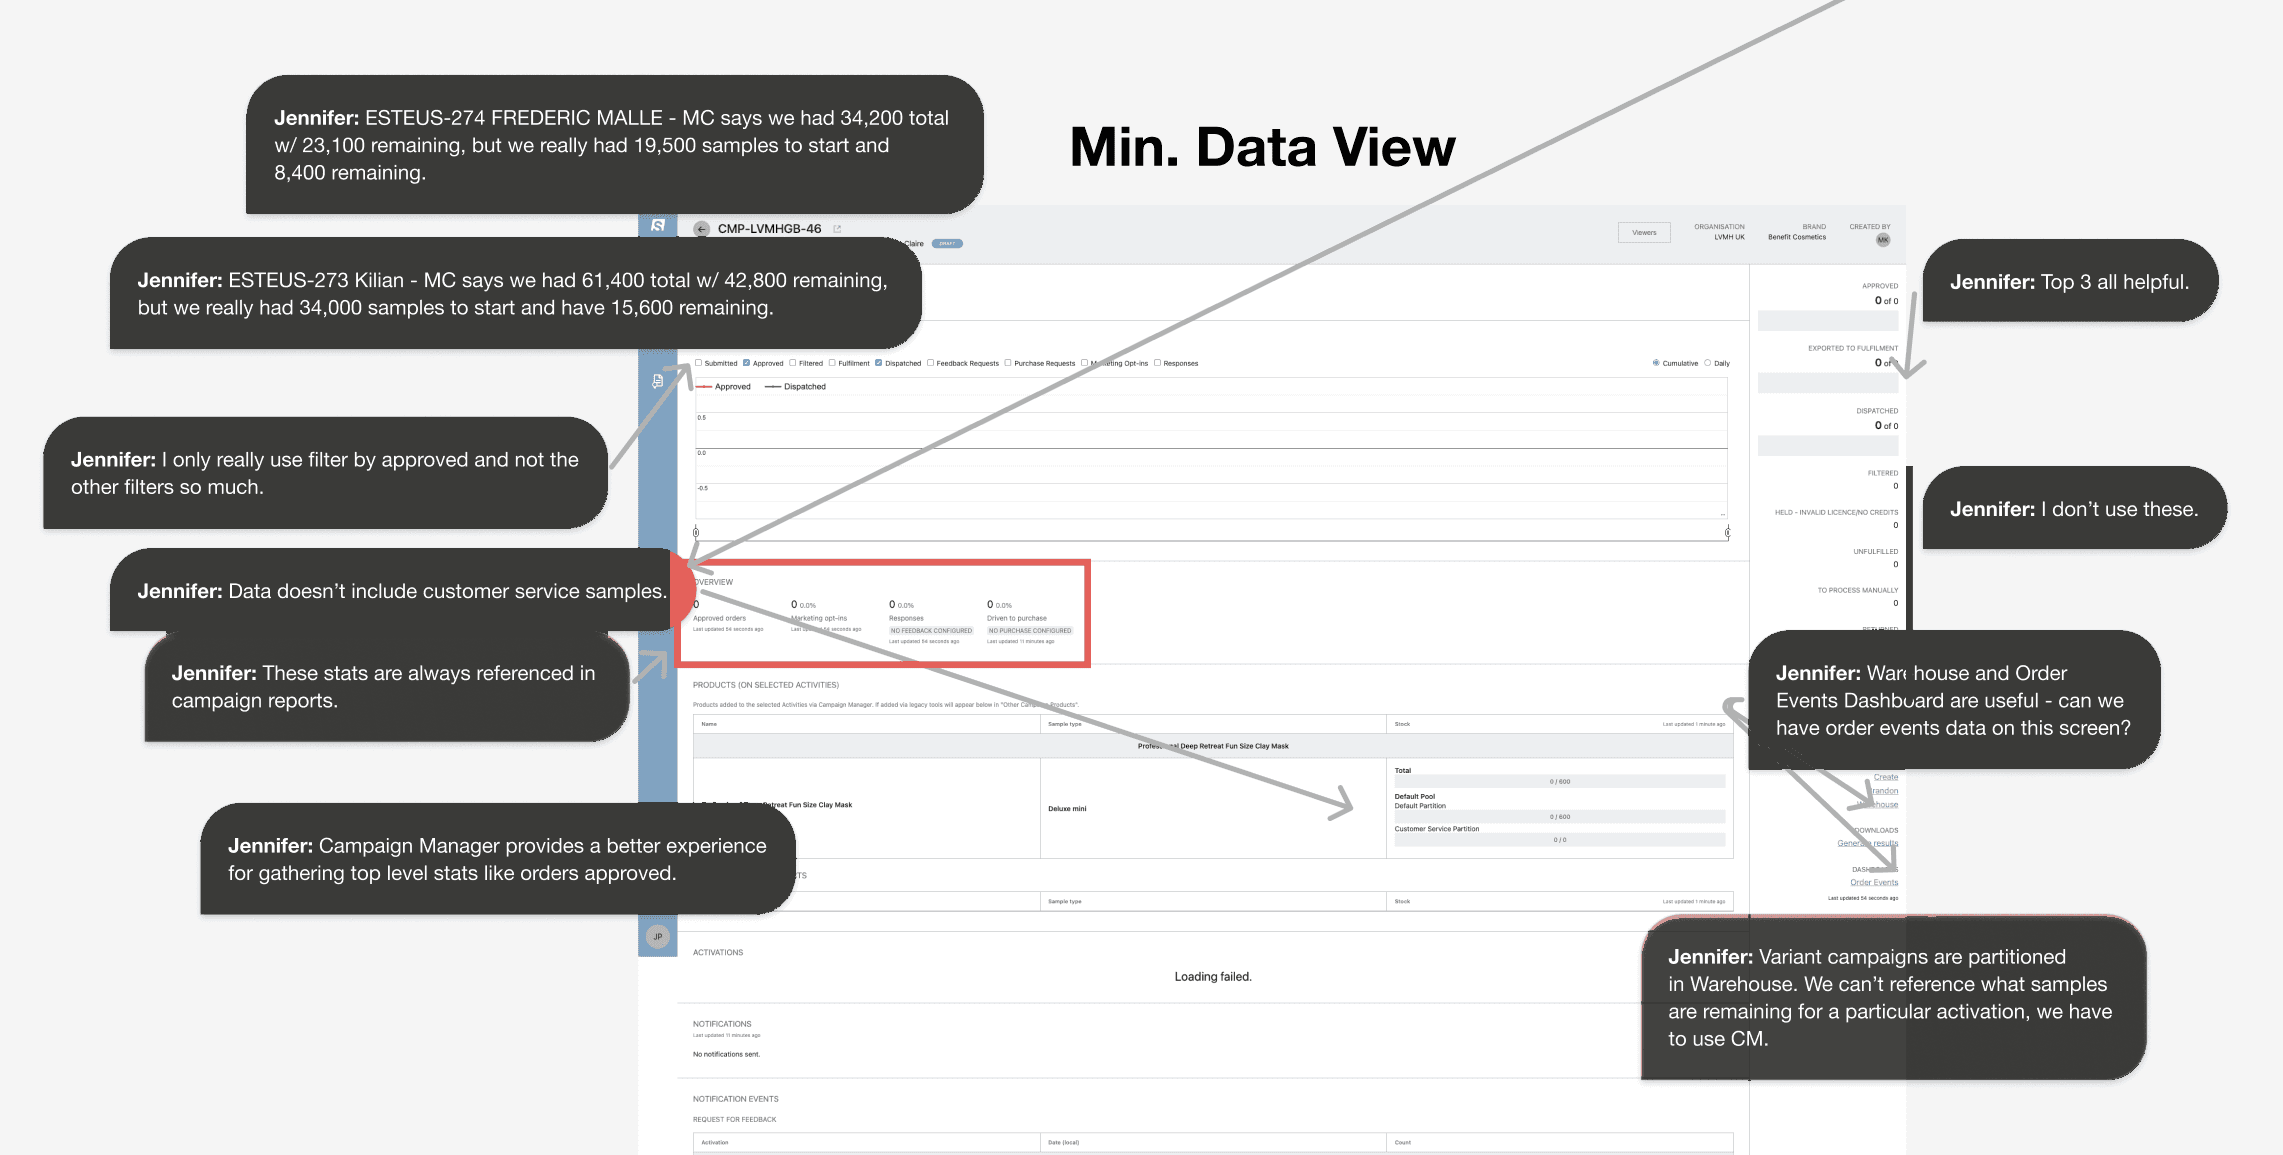
Reporting had become fragmented and unreliable. Mission Control was built for engineers, and Commercial had ended up relying on it anyway. Campaign Manager split reporting across isolated pages. Between them the two systems refreshed at different rates, duplicated charts, and disagreed on metrics that shared a name, and nobody held a clear picture of how the datasets connected.
The effect was cumulative. Every brand report had to be compiled by hand from sources that did not agree, which took hours and left the numbers open to question once they arrived.
Process
The audit started with the people using the data. Commercial sat across North America, Australia, the UK, France and Germany, and each market had settled into its own way of reporting. They kept coming to me with gaps and differences in their numbers, which made their decks hard to understand and talk through. Building the WMS had already uncovered discrepancies in the data, including mismatched refresh rates between the two systems.
I audited every existing reporting view across Campaign Manager and Mission Control, documenting duplication and logic gaps. The picture became much clearer: the discrepancies ran deep, and there was no single, central reporting hub.
In parallel, I worked with the Commercial Team to review the reports they shared with brands, pinpointing where manual edits and visual inconsistencies created risk.
The audit didn’t say Mission Control had to go. Engineers found it useful, and it was built for them. The problem was that Commercial had been given access to a developer tool, and were pulling numbers out of it for brands. My proposal to the CTO was to keep Mission Control for engineering, build Commercial reporting of their own, and treat that as product work rather than maintenance.
Research and Testing
To validate direction, I interviewed eight people across Product, Commercial, Engineering and Operations. Using a Figma-based testing matrix, I mapped their workflows and captured pain points. The findings were consistent:
- People were piecing together insights across multiple tools
- Each team defined “reporting” differently (fulfilment vs engagement vs exports)
- No one had a full, end-to-end picture of campaign performance
That was enough to get the rebuild properly backed.
Part Two
Redesigning the Reporting Experience
Problem
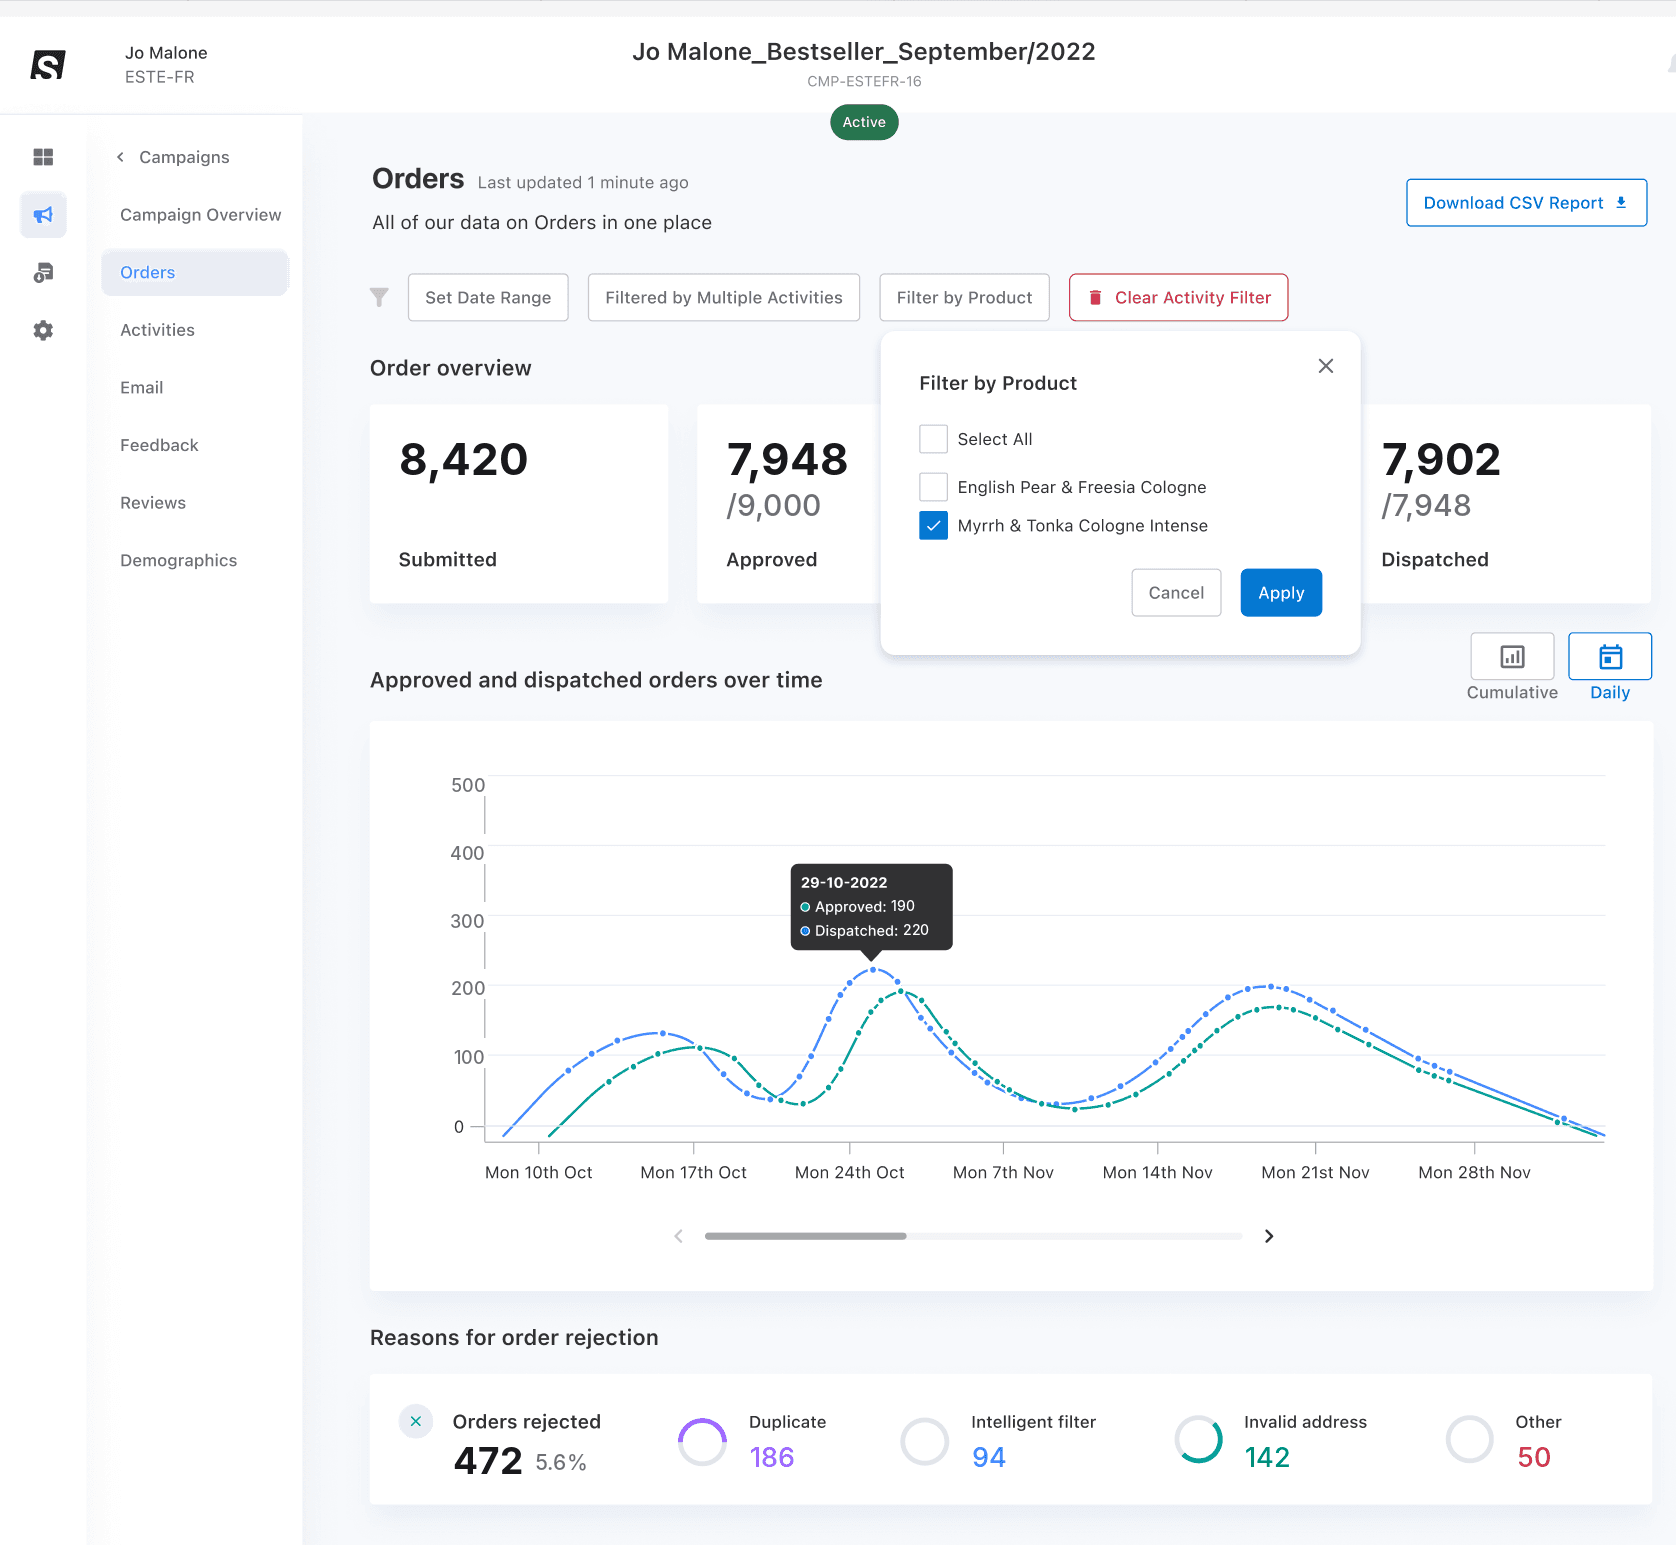
Campaign Manager’s reporting pages (Overview, Orders, Demographics, Feedback and Reviews) existed in isolation. There was no hierarchy, shared data model or visual consistency.
Design Approach
I defined a single Reporting Hub that could:
- Unify data sources under one structure
- Standardise metrics, terminology and visualisation styles
- Simplify navigation, so people could find things without being told where they were
- Show where a number came from, so people could check it rather than take it on faith
Exploration
I created a series of prototypes exploring:
- Mapped how data moved between systems as it was, and as it needed to be
- Card-based layouts grouping metrics by performance type
- Standardised filters, comparison modes and accessibility patterns
- Error and low-data states, so a gap looked like a gap rather than a zero
- Early versions of the brand-level summaries, and the structures the ROI work would later need
Each iteration was reviewed with Product, Commercial and Engineering to ensure the hierarchy reflected how insights were actually used and shared.
Impact
The new Reporting Area established a single source of truth for campaign performance.
A complex brand report took up to eight hours to assemble. The redesign halved it, and introduced consistent visual language and data standards across every team.
Both figures came from the Commercial team themselves, in face to face sessions. Nobody was tracking report build time, so these are their estimates, consistently given.
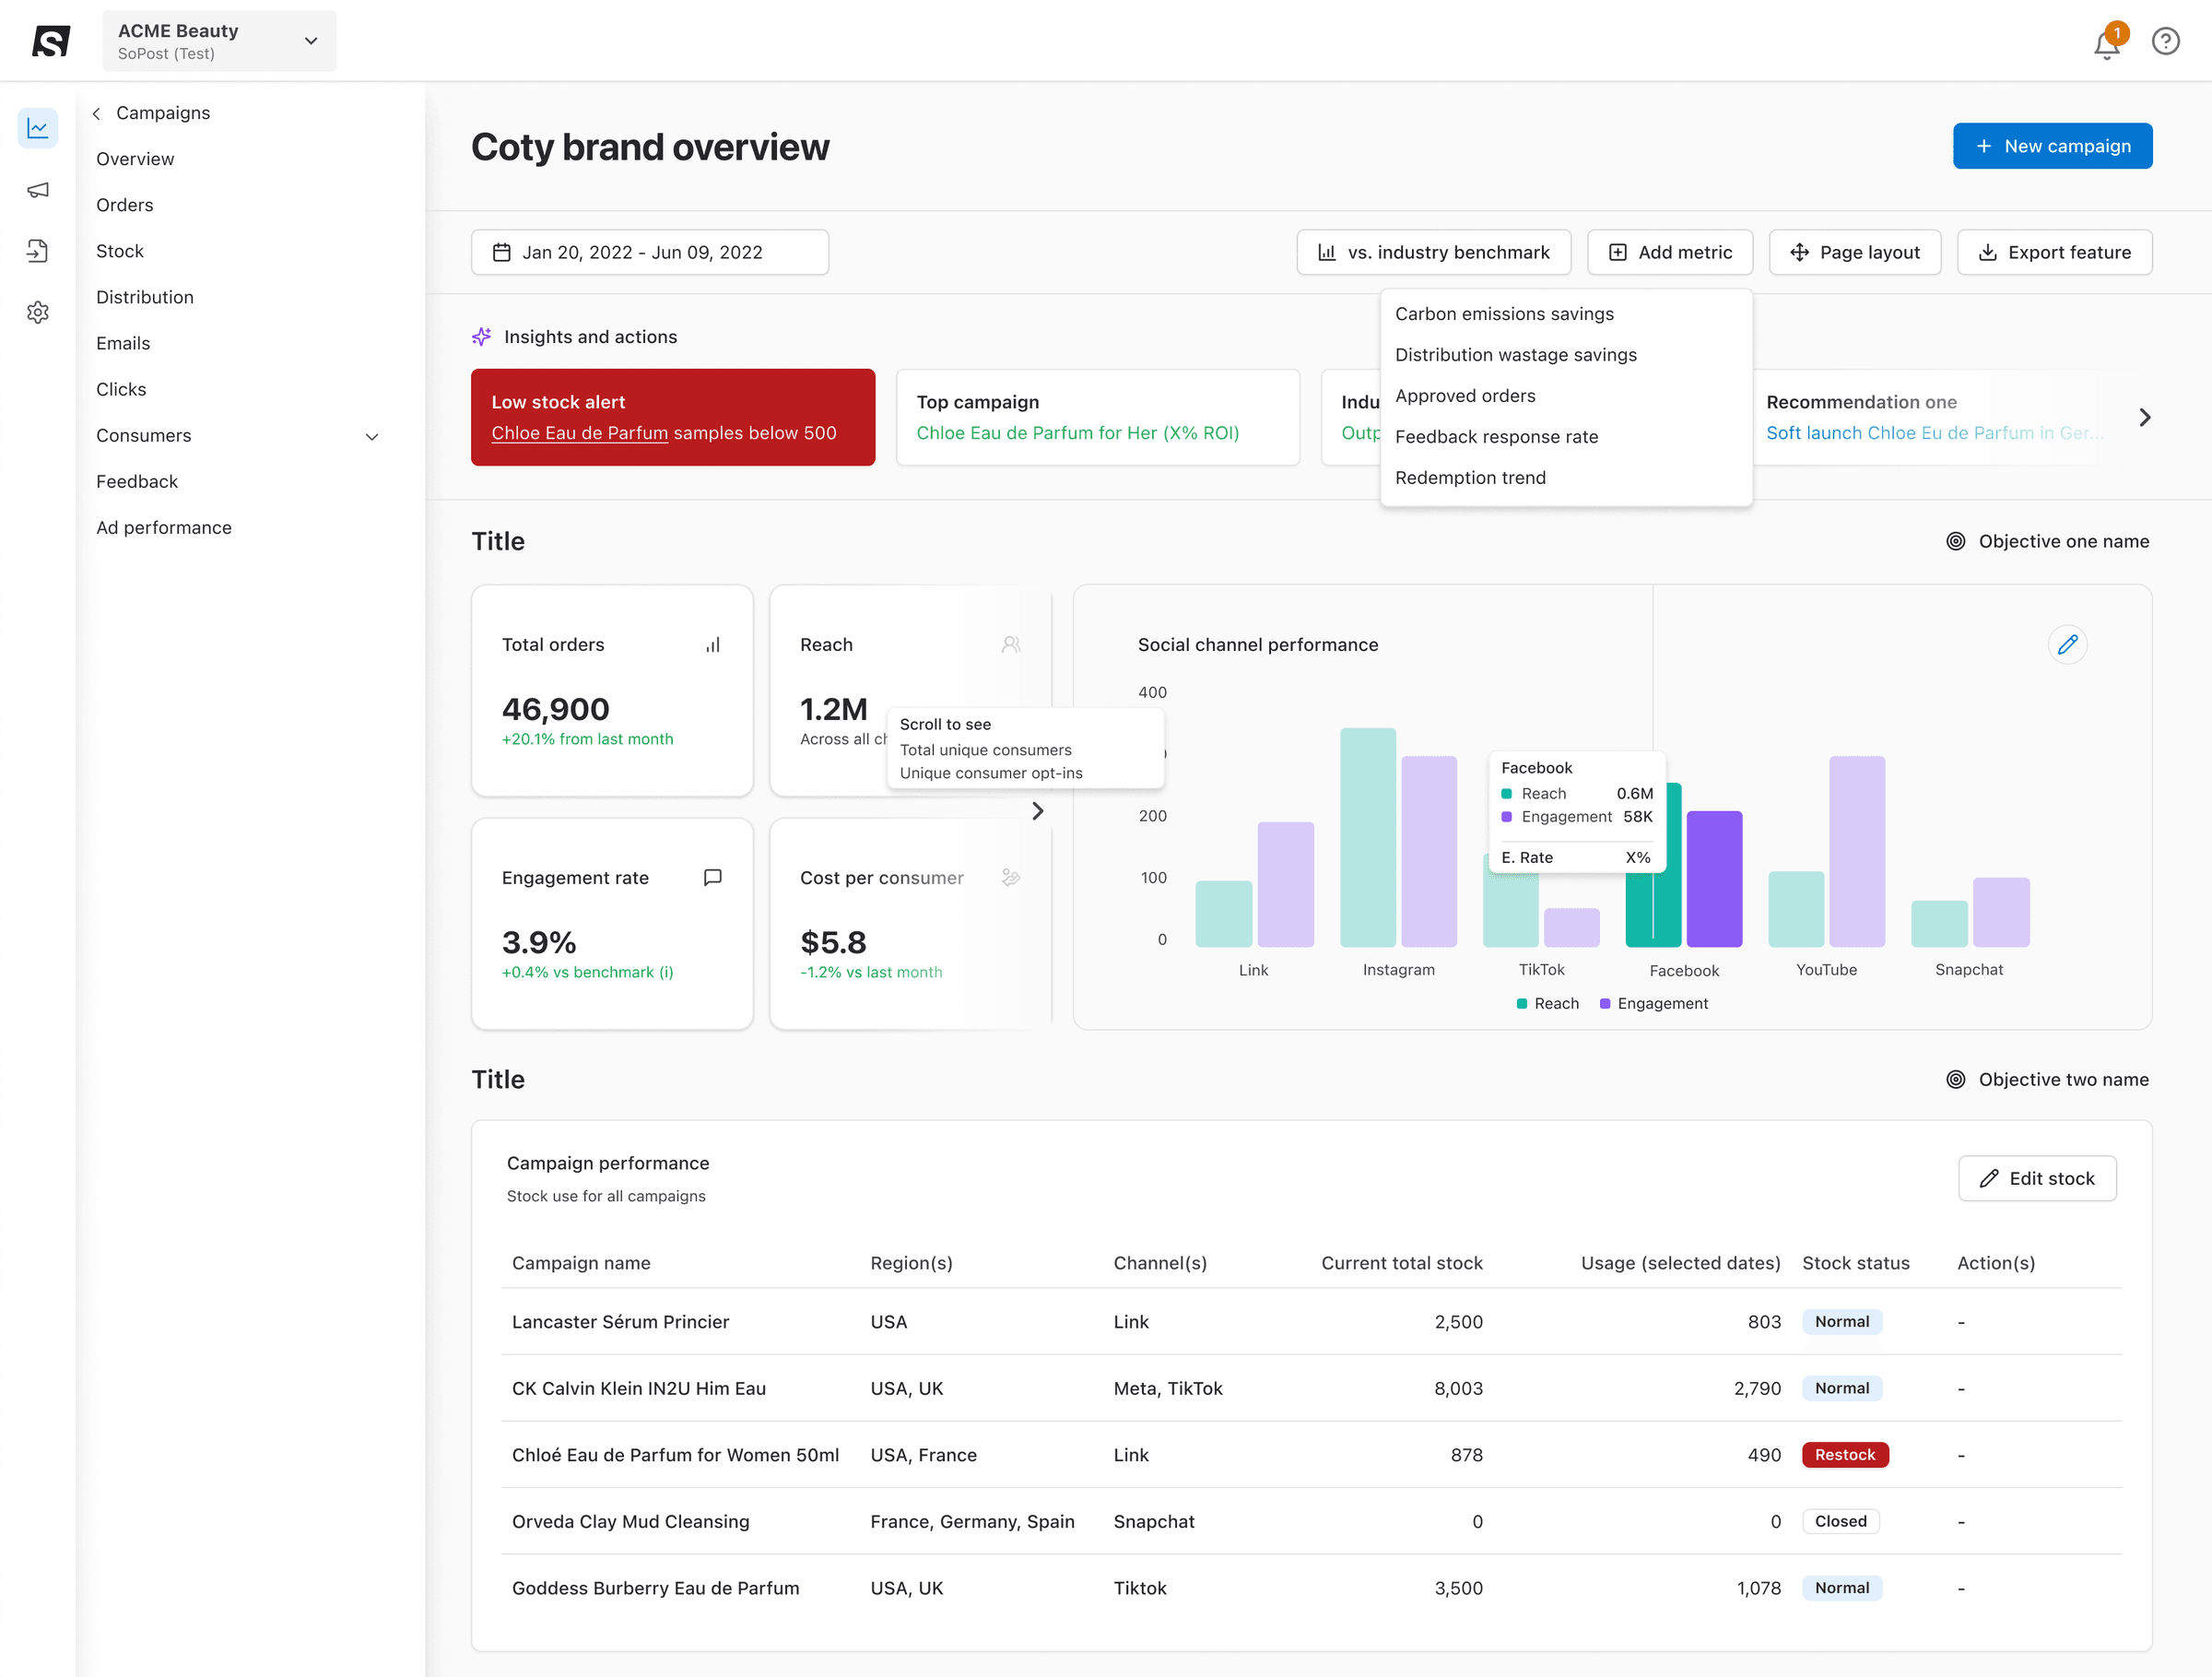
The work carried on well past 2024. That foundation became SoPost’s ROI and Impact Dashboards, Comparison Tables and the Reporting Hub, which I picked up with our Product Manager the following year.
By 2025 it had become a new hub layout rather than a reworking of the old pages, prototyped in shadcn so the components were real rather than drawn. This is as far as it got.
Reflection
Staff trusted the numbers again. The tools were joined up, Engineering and the Commercial Team were working from the same definitions, and reporting stopped being something you rebuilt by hand every time.
It became the foundation for everything that followed. The stock work and the ROI dashboards both trace back to that audit. What started as an argument about whose numbers were right ended with one set everybody used.
“I had the pleasure of working with Jade for nearly three years at SoPost, where she was a driving force behind the evolution of our design and reporting capabilities.”
Let’s improve something together.
Open to part-time roles and fractional contracts, two to three days a week.